Limited lithium supply is hindering the global transformation towards electrification and decarbonization. Current lithium mining can be energy, chemical and land intensive. Here we present an efficient and self-concentrating crystallization method for the selective extraction of lithium from both brine and seawater. The sequential and separable crystallization of cation species with different concentrations and solubilities was enabled by a twisted and slender 3D porous natural cellulose fibre structure via capillary and evaporative flows. The process exhibited an evaporation rate as high as 9.8 kg m−2 h−1, and it selectively concentrated lithium by orders of magnitude. The composition and spatial distribution of crystals were characterized, and a transport model deciphered the ion re-distribution process in situ. We also demonstrated system scalability via a 100-crystallizer array.
On the left, Schematic of the 3D spatial crystallization process. At the bottom position (Bottom), mixed Li and Na ions are carried upward via capillary flow. At the middle position (Middle), NaCl saturates and crystallizes, while Li species continue to move upward with the water flow. At the top position (Top), Li ions precipitate when the saline water completely evaporates. On the right, The Li/Na ratio increased along the 3D fibre crystallizer, with Li concentrated by >39 times at the top when using brine and >675 times at the top when using seawater.
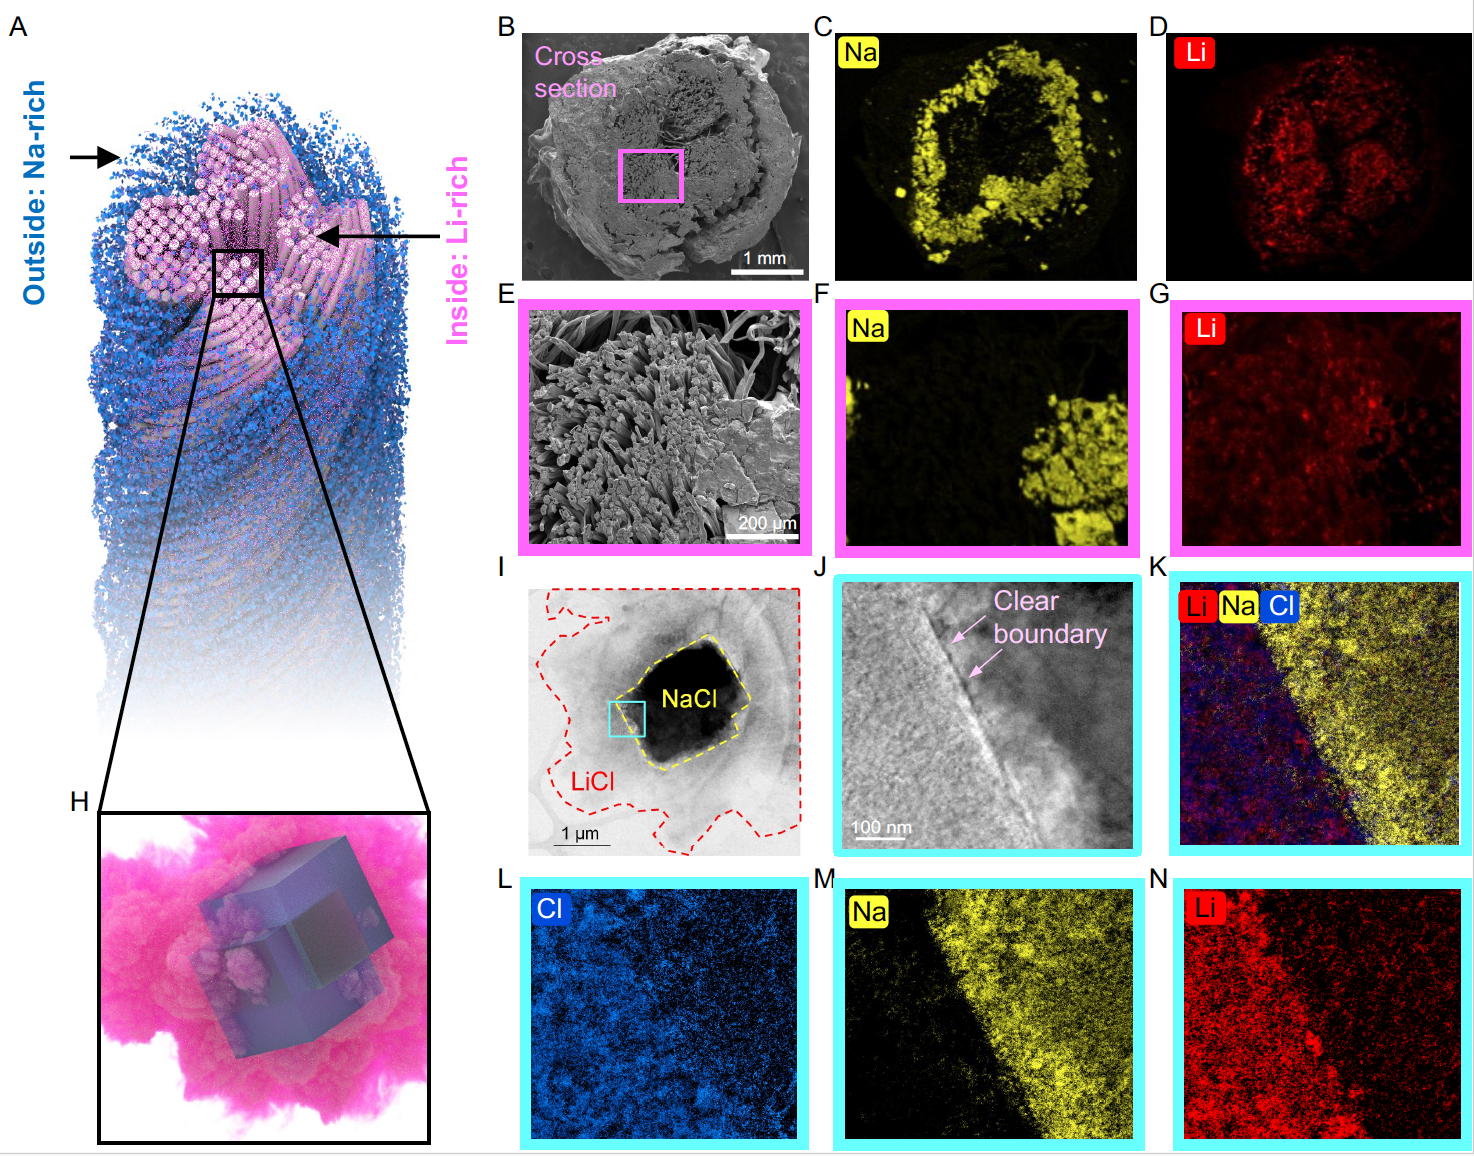
Li is concentrated at the centre of the fibre crystallizer. a, Schematic showing that Li is concentrated inside the fibre crystallizer, surrounded by the Na-rich salt shell. b, SEM image of the cross-section. c, Na elemental map from the EDX, showing a circular shape surrounding the crystallizer structure. d, Li elemental map from the EDX, showing a dispensed distribution across the crystallizer’s cross-section. The Li elementary map was calculated by deducting the Na map from the Cl map. e, SEM image of the area between the fibres and salt crystals, pink-boxed in b. f, Na elemental map from the EDX, showing that only the salt crystals emitted clear Na spectra, while the fibre area showed no Na signal. g, Li elemental map from the EDX, showing that Li spectra were widely detected over the fibre areas, with the weakest signal at the bottom-right corner, where the NaCl crystals are located. h, Schematic showing that, in the centre Li-rich part, cubic NaCl crystals (blue) act as a core and LiCl form surrounding amorphous salt (pink). i, S/TEM image of the salt crystal sampled from the centre. j, TEM image of the blue-boxed area in i, showing a clear boundary between the two types of salt crystal. k, Layered EELS map confirmed two different elemental components aside the boundary. l–n, Cl (l), Na (m) and Li (n) elemental map from EELS. Cl covered the whole scope, and Na distributed only at the right side of the boundary, while Li distributed mostly at the left side.
Practical feasibility of the spatial crystallization system using simulated seawater. a, Photo of a prototype Li extraction array containing 10 × 10 3D spatial crystallizers. Salt crystals are shown on blue cellulose fibre crystallizers. b, Li salt recovery by the wash–soak method. After removing the salt shell, the crystallizer was dipped into water to wash off and generate a Na-rich solution. Subsequently, the crystallizer was soaked in clean water bath for Li dissolution and recovery.
Please read more in our work (Yang et al., 2023).


